Talk to your data.
Cut your energy costs with Opti
Opti turns complex building energy data into simple, natural conversations.
Our Solutions
Complete Energy Management Suite
- Real-time PV generation monitoring
- Performance analytics & forecasting
- Anomaly detection
- Weather integration


Simulate optimal solar panel placement on your building's rooftop. Get detailed analysis from monthly generation forecasts to electricity cost savings, investment payback period, and CO2 reduction impact.
How Opti Works : Simple • Powerful • Intelligent
Ask Questions
Simply ask your question naturally
Hi, I’d like to check the PV analysis results for our building.
What's the best ESS strategy for reducing our peak loads?
Hi, I’d like to check the PV analysis results for our building.
What's the best ESS strategy for reducing our peak loads?
Hi, I’d like to check the PV analysis results for our building.
What's the best ESS strategy for reducing our peak loads?
Hi, I’d like to check the PV analysis results for our building.
What's the best ESS strategy for reducing our peak loads?
Can you give me a quick overview of the energy analysis results?
What are the top factors that impact our cost savings?
Can you give me a quick overview of the energy analysis results?
What are the top factors that impact our cost savings?
Can you give me a quick overview of the energy analysis results?
What are the top factors that impact our cost savings?
Can you give me a quick overview of the energy analysis results?
What are the top factors that impact our cost savings?
Analyze Data
AI processes your data in real-time
Raw Data
OutPut
Insights
Get clear actionable insights
Zone-wise Energy vs Response Time
Take Action
Implement changes immediately
Clean Outdoor HVAC Units
Clean Outdoor HVAC Units
Solar Panel Installation
Rooftop solar power generation system setup
LED Lighting Replacement
Replace fluorescent lights with LED fixtures
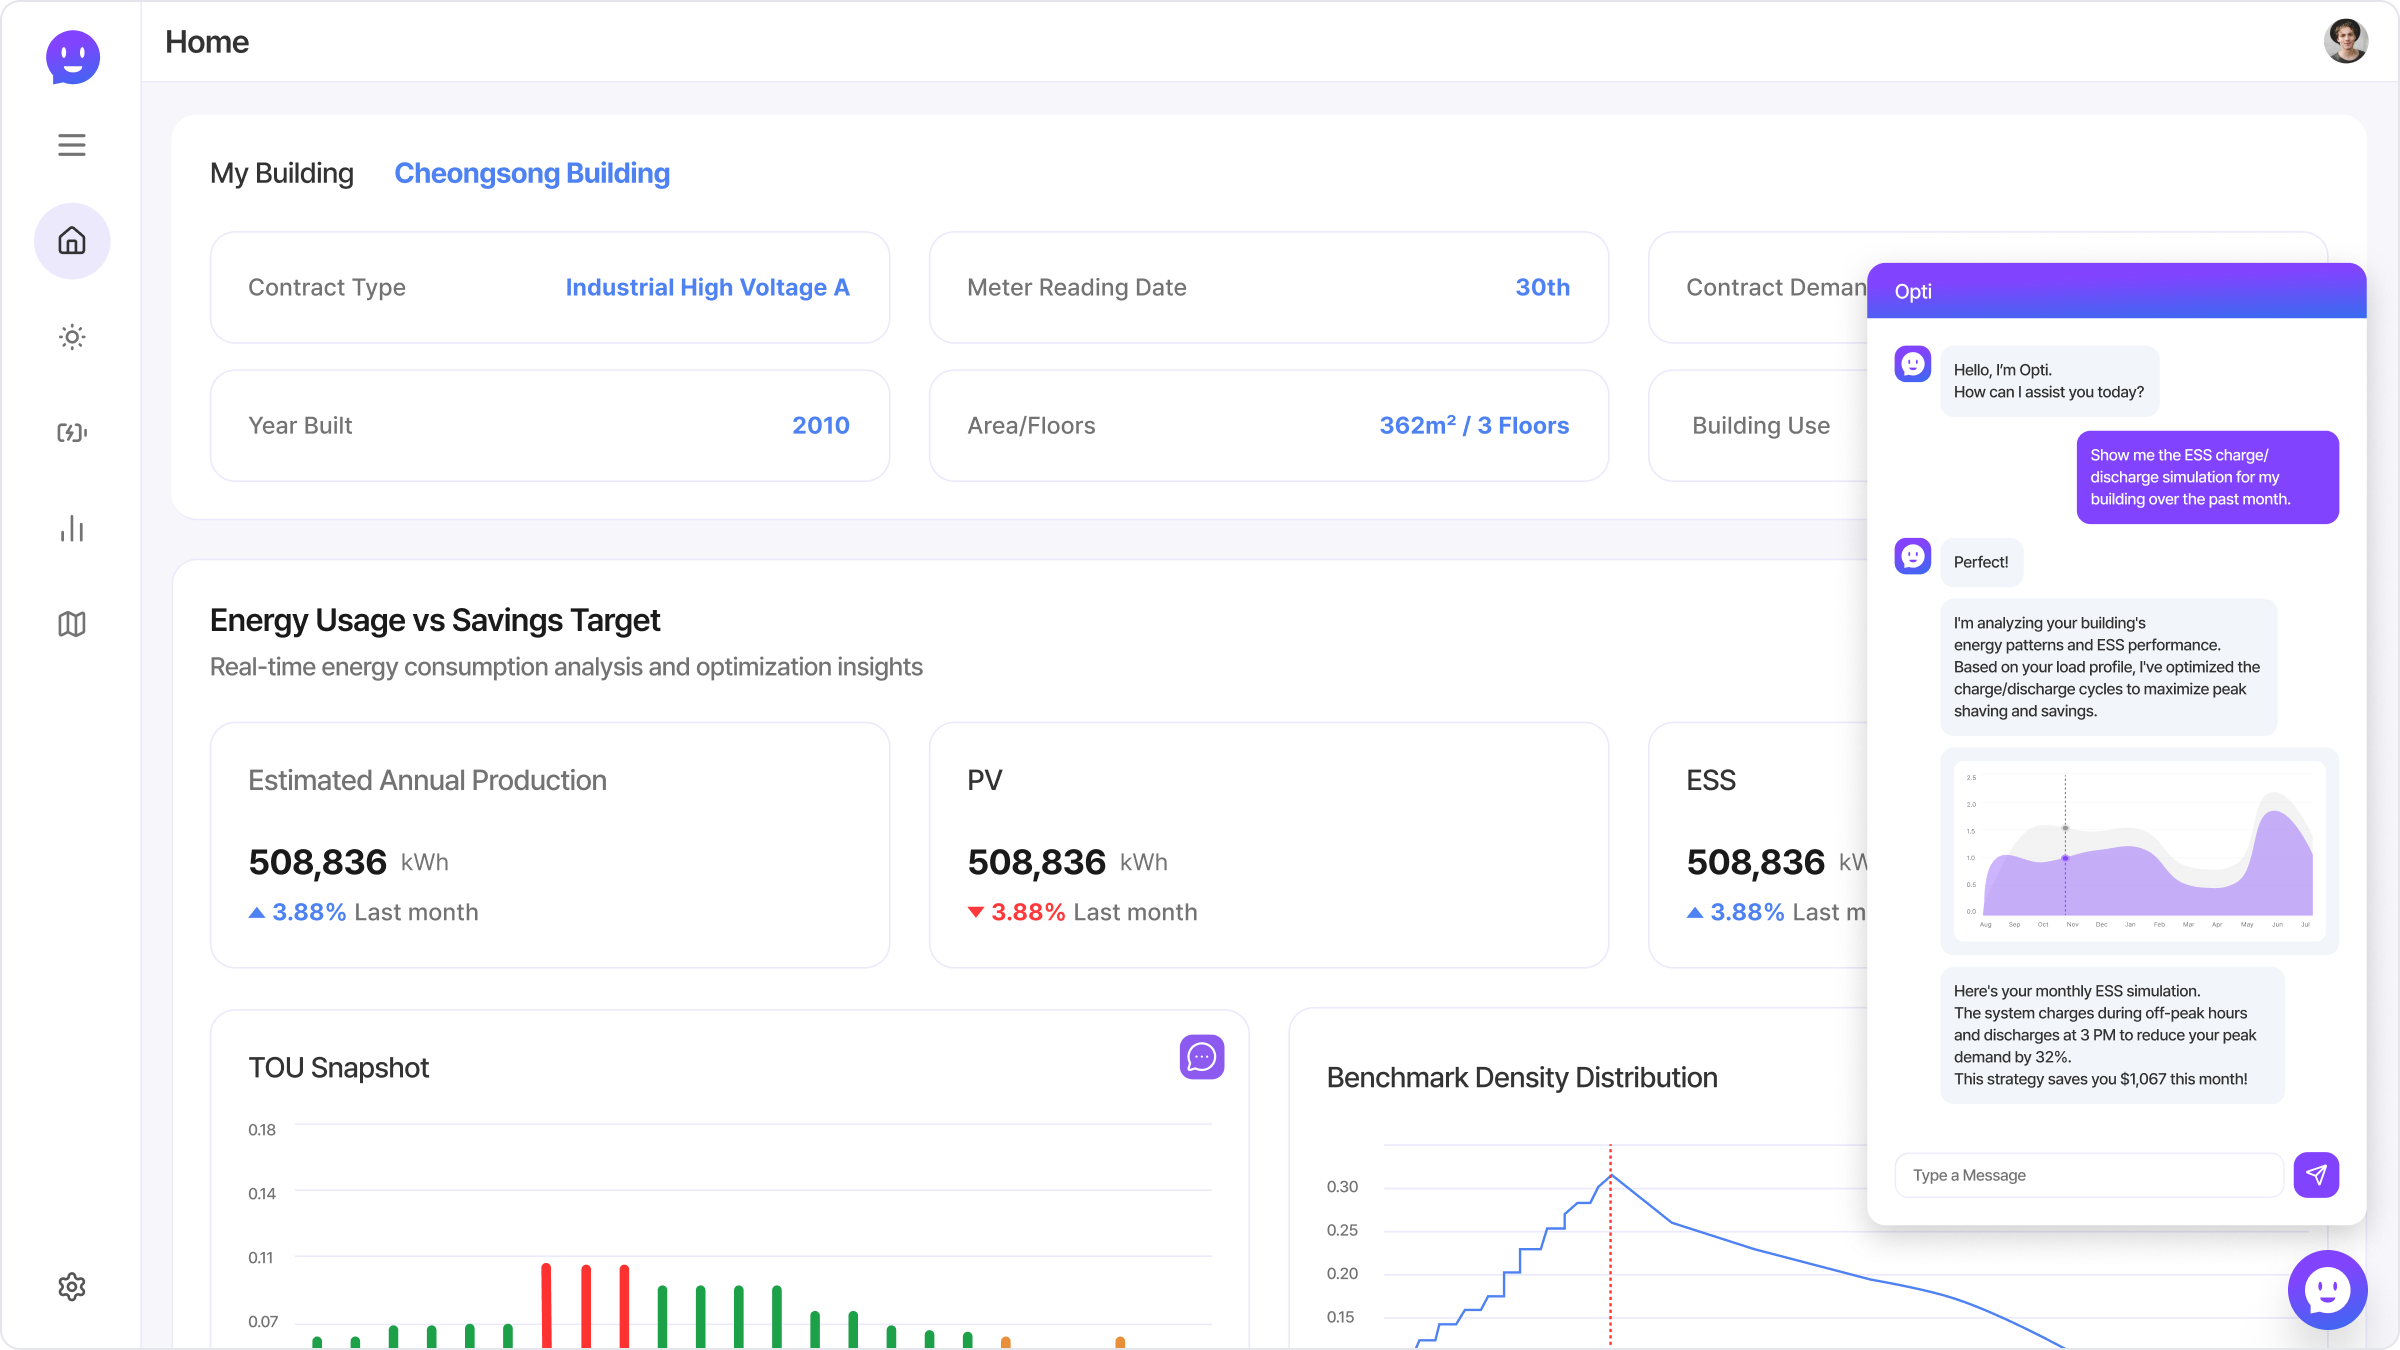
Hello, I'm Opti. How can I assist you today?
Show me the ESS charge/discharge simulation for my building over the past month.
Perfect! I'm analyzing your building's energy patterns and ESS performance.
Based on your load profile, I've optimized the charge/discharge cycles to maximize peak shaving and savings.

Here's your monthly ESS simulation. The system charges during off-peak hours and discharges at 3 PM to reduce your peak demand by 32%. This strategy saves you $1,067 this month!
Beyond Visualization:
Actionable Energy Insights
Pricing for inception to scale
Transparent and scales with features you use, not your expenses.
Save up to 17% with yearly
Core insights for single site
Energy Dashboard
Impact Factor
Advanced analytics & ROI
Energy Dashboard
Impact Factor
PV, ESS
API, dashboard, portfolio tools
Energy Dashboard
Impact Factor
PV, ESS
AI Agent
Custom Map Layer
Custom
White-label / integration / multi-siter bulk
Energy Dashboard
Impact Factor
PV, ESS
AI Agent
Custom Map Layer
Custom Analysis Module
Build smarter workflows with Opti
Experience Opti with a personalized demo. We'll be in touch within 24h.